Blog
November 17, 2026
·8 min readDoes a 3D Product Configurator Actually Increase Sales? What the Evidence Shows

Otuokon Nsikak
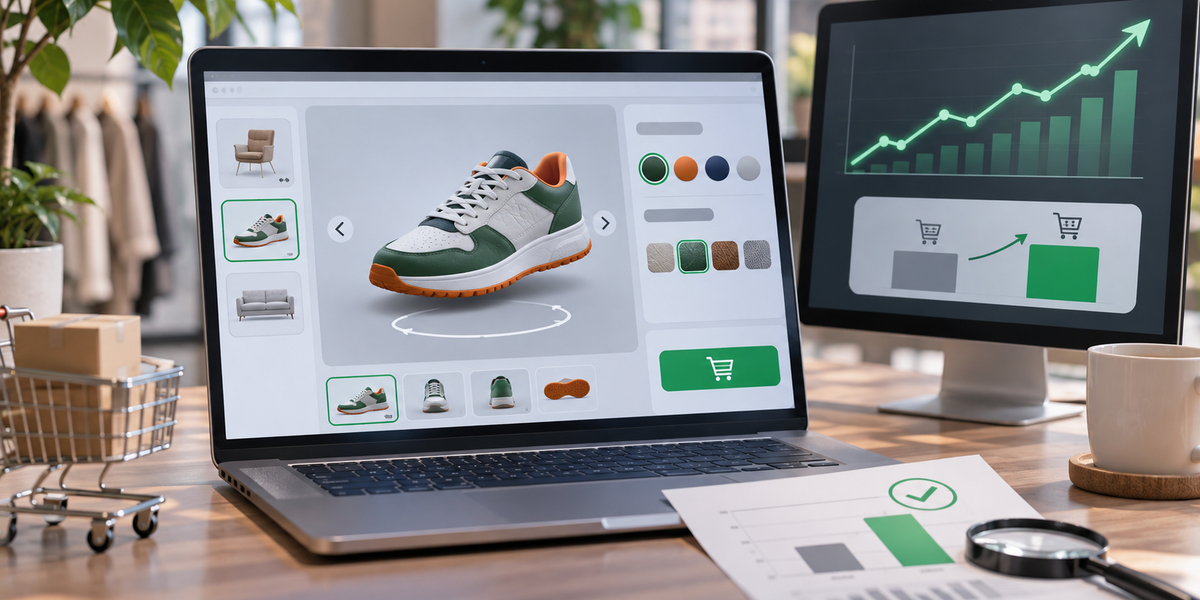
Quick answer: Often, but usually by less than the headline numbers suggest. A 3D product configurator tends to help most when a product has many options and real buyer uncertainty; furniture, modular systems, and customisable goods are the clearest examples. The largest published lifts come from vendor case studies that compare performance before and after launch. Those results prove large gains are possible. They are not a reliable forecast for your store.
The more useful question is when a configurator is worth building and how to measure whether yours actually moved the numbers.
What the published case studies show
Two well-documented cases illustrate the range of what is reported. Both were published by the vendors that supplied the technology, which affects how the numbers should be read.
Furniture retailer EQ3 reported a 36% increase in conversions, an 88% increase in average order value, and a 116% increase in page views after adding a 360-degree HD viewer and web AR, according to the case study published by its provider, Cylindo. The case study notes that EQ3 tracked results via Google Analytics integration for the 360 HD Viewer and AR experience. It does not describe a controlled holdout or A/B test, nor the exact time window of the comparison. AR users at EQ3 converted at a 112% higher rate than non-users, with roughly 2× higher AOV.
Pepper spray maker POM sells 72 variations (three models, three colours, eight band colours). Shoppers struggled to tell the options apart from images. After adding a Sketchfab-powered 3D configurator to its Shopify store, Sketchfab reports conversion moving from 0.82% to 3.65% and average order size from $18.09 to $26.72 (roughly 48% higher). Sketchfab labels the conversion change as 340%; the arithmetic on those two figures is closer to 345%, so the before-and-after rates are the clearer reference. No control group is described.
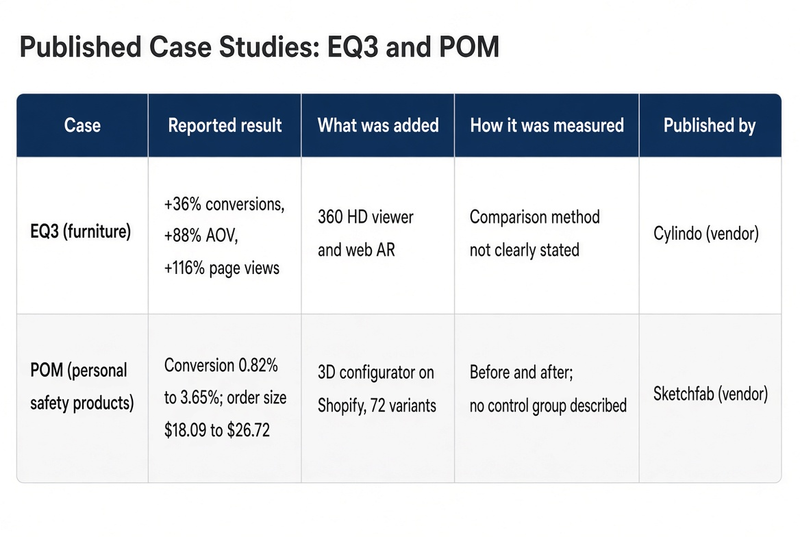
Both results are real enough to take seriously. Neither tells you what would happen on your product pages. POM is close to an ideal case: a relatively low-priced product with a large number of hard-to-distinguish variants.
How to read vendor-published results
Most public numbers on this topic come from companies that sell the technology. That does not make them false. It does mean three things are worth checking every time.
First, what was added. A viewer, an AR button, and a full configurator are different interventions, and case studies often blur them. Second, how it was measured. A before-and-after comparison captures seasonality, campaigns, and traffic changes along with the configurator. A holdout or A/B test isolates the effect. Third, who was counted. Figures that compare shoppers who chose to use the 3D experience with those who did not mostly measure intent, because people who engaged were already more likely to buy.
When controlled or cleaner comparisons appear, reported lifts tend to be more modest than the largest case-study headlines. One example is Shopify’s Gunner Kennels case study, which reported a 40% increase in order conversion rate and a 5% reduction in returns after adding native 3D models and AR (measured against the prior quarter). Rebecca Minkoff saw shoppers who interacted with 3D models 44% more likely to add to cart and 27% more likely to place an order; those who used AR were 65% more likely to purchase.
A figure of roughly 94% higher conversion for products with 3D or AR content is frequently attributed to Shopify merchant data. It appears widely in secondary sources but is not easily traced to a single primary Shopify publication with methodology. Treat it as directional rather than a precise benchmark.
Where the lift comes from
When results are strong, they usually come from three places.
Conversion. Uncertainty about colour, scale, finish, or fit stops purchases. Letting shoppers see the exact option they care about reduces that doubt.
Order value. Shoppers trade up to premium finishes and add components more readily when they can see the difference. Both EQ3 and POM reported higher order values, which suggests the effect is not only about getting more people to buy.
Returns. Many returns in furniture, apparel, and configurable goods come from a visual mismatch. Accurate 3D and AR can narrow that gap. Documented examples include Gunner Kennels’ 5% return reduction (Shopify case study) and Ann Gish’s 35% reduction in buyer’s-remorse returns on Wayfair after deploying Cylindo visualization (Cylindo reporting). Cylindo has also cited an average ~40% return reduction across its customer base in its trends materials. These figures are vendor- or brand-reported, and methods vary.
When a configurator is worth building
It is most likely to pay off when:
- The product has meaningful options (fabrics, finishes, modules, sizes).
- Buyers are unsure about scale, fit, or material.
- Order value is high enough that a modest lift covers the work.
- The experience is fast on mobile, accurate to the real product, and connected to price and cart.
It is less likely to move results for simple products that photograph well and are already well understood. A slow model, an inaccurate material, or a configurator that does not connect to checkout will underperform even in the right category.
What this means if you sell to businesses
Most published evidence comes from consumer stores, but the underlying logic carries over to wholesale and B2B selling, with different measures of success.
For distributors, brands selling through dealers, and agencies managing multiple storefronts, the costs of uncertainty show up as quote requests that need a rep to clarify, order errors from misunderstood options, and slow sales cycles. A configurator that shows buyers exactly what they are ordering can reduce that back-and-forth. The metrics to watch are quote-to-order rate, order accuracy, time to quote, and sales-rep hours per order, alongside conversion rate.
How to measure your own lift
Do not rely on someone else’s number. Run your own test, and decide in advance what counts as success.
Compare conversion rate and add-to-cart rate on configurator pages against a control group of similar products or a holdout share of traffic. Track revenue and average order value for configured products, and return rate over a long enough window to catch late returns. Use engagement time and options explored as leading indicators, not as proof of return on investment. An A/B test or holdout beats a before-and-after comparison, because it separates the configurator from everything else that changed.
For practical sample-size guidance, many ecommerce teams aim for at least several hundred to a few thousand sessions per variant (depending on baseline conversion rate) before calling a test. Tools such as Optimizely’s sample-size calculator or similar A/B test calculators can help set expectations for your traffic level.
Where SwiftXR fits
SwiftXR is a browser-based, no-code platform for publishing interactive 3D and AR product experiences, including product configurators, with AR that opens on a phone without an app. It integrates with Shopify, Wix, Webflow, WordPress, and Bubble, or can be embedded on a custom site. Analytics include experience views (counted after at least 5 seconds), engagement, and interactions; higher plans unlock a fuller dashboard. See current details on the pricing page and features page.
That gives a team a way to test the idea on one product before committing a whole catalogue: publish a configurator, measure conversion and order value against a control, and expand only if the numbers justify it.
Frequently asked questions
Does a 3D product configurator increase conversion rates?
It can, especially for products with many options and high buyer uncertainty. Published case studies report meaningful increases, but most are vendor-published before-and-after comparisons, so test on your own products before assuming a figure.
Do configurators increase average order value?
Some case studies report this, including EQ3 and POM. Shoppers tend to choose premium finishes and extra components when they can see them clearly. Measure it separately from conversion.
Do 3D and AR reduce returns?
They can when returns are caused by visual mismatch. Documented examples include Gunner Kennels (5% reduction, Shopify case study) and Ann Gish (35% reduction in buyer’s-remorse returns on Wayfair). Figures vary by category and method and are often vendor- or brand-reported. Track returns on configured products over a long window.
Which products benefit most?
High-variant, high-consideration or visually complex products: furniture, modular systems, customisable goods and similar categories. Simple, well-understood products with strong photography usually see smaller gains.
How should I test whether it works?
Use an A/B test or holdout on comparable products, track conversion, order value and returns, and decide success criteria before launch.
Test it on one product
Start with a single product that has real options and real buyer questions. Publish a configurator, measure it against a control, and let your own data decide whether to expand.